Analytics
In the digital realm, data is your compass, guiding you towards informed decisions and a successful online journey. Our Analytics section is your dedicated insight hub, offering a wealth of information to elevate your performance. Here's a snapshot of what you can expect:
What is Analytics?
Analytics is a comprehensive tool that empowers users to make data-driven decisions, optimize their strategies, and gain valuable insights into their online performance. It serves as a central hub for data analysis, reporting, and monitoring within the platform.
Built-In Analytics System:
Unlike typical WordPress websites that require third-party plugins for tracking, we've integrated a powerful, in-house analytics system. No need for additional installations; you'll find comprehensive data tracking right within your reach.
Benefits of Analytics:
Analytics, an integral part of our platform, offers users a myriad of advantages, transforming data into actionable insights that drive success. Here are the key benefits users can reap from our analytics capabilities:
- Informed Decision-Making: Analytics equips users with data-backed insights, enabling informed decision-making. Whether refining marketing strategies or optimizing content, data-driven choices lead to better outcomes.
- Real-Time Performance Tracking: Users can monitor client acquisition system, sales funnel, and marketing campaign performance in real-time. This visibility allows for prompt adjustments and continuous growth.
- Enhanced Conversion Rates: Analytics identifies where conversions occur and potential drop-off points. This insight empowers users to streamline conversion paths, resulting in increased conversion rates.
- Resource Allocation Optimization: By pinpointing effective marketing channels and touchpoints, users can allocate resources more effectively, maximizing return on investment (ROI).
- Refined Marketing Strategies: Attribution reports enable users to fine-tune marketing strategies, focusing on high-impact touchpoints for more efficient and cost-effective campaigns.
- Insight into Customer Journeys: Analytics provides valuable insights into customer journeys, helping users tailor personalized and targeted marketing efforts that resonate with their audience.
- Goal Achievement Tracking: Users can set and track specific goals, measuring progress and adapting strategies to achieve these objectives.
- Competitive Edge: Data-driven insights give users a competitive edge, allowing them to adapt quickly to market shifts, outpace competitors, and meet evolving customer needs.
- Improved User Experience: By analyzing user behavior, users can enhance the client acquisition system's user experience, resulting in increased engagement and higher satisfaction levels.
- Cost Efficiency: Efficient resource allocation and optimized strategies lead to cost savings. Users can reduce spending on less effective channels and focus resources where they yield the best results.
In a data-driven digital landscape, analytics empowers users to unlock the full potential of their online presence. By translating raw data into actionable knowledge, users can refine strategies, achieve their goals, and maintain a competitive edge in a dynamic and competitive environment. With analytics, success isn't just attainable; it's measurable and within reach.
Exploring the Funnel Section:
Here's a step-by-step procedure for setting up and utilizing the analytics feature:
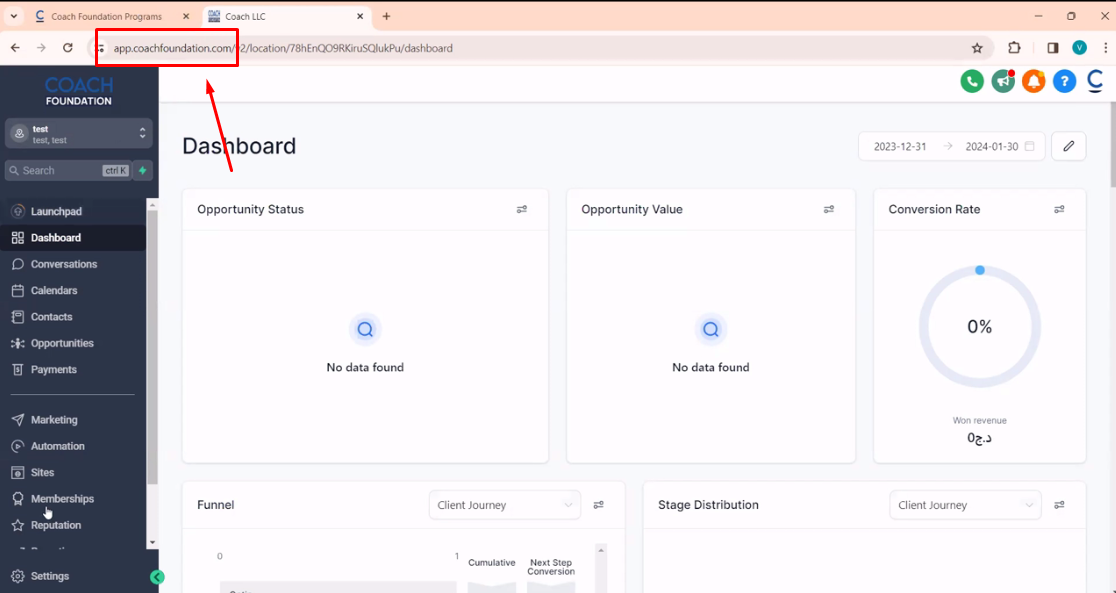
1. Navigate to Coach Foundation Portal:
Open your web browser and go to the Coach Foundation portal at app.coachfoundation.com.
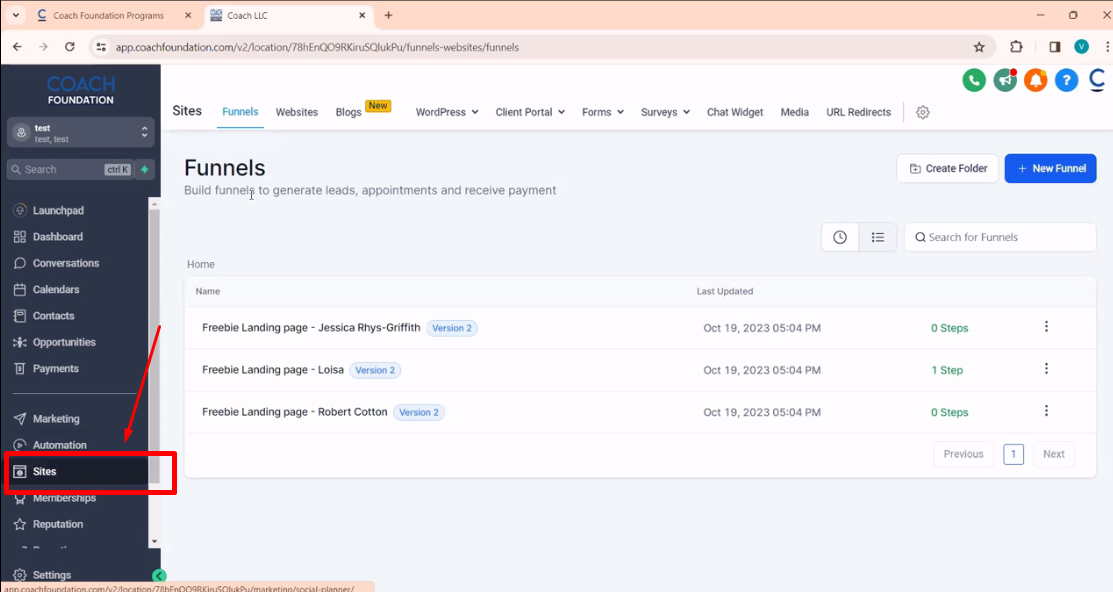
2. View Existing Funnels:
Click on "Sites" in the navigation bar on the left-hand side. Here, you will see a list of all the funnels that have been created.
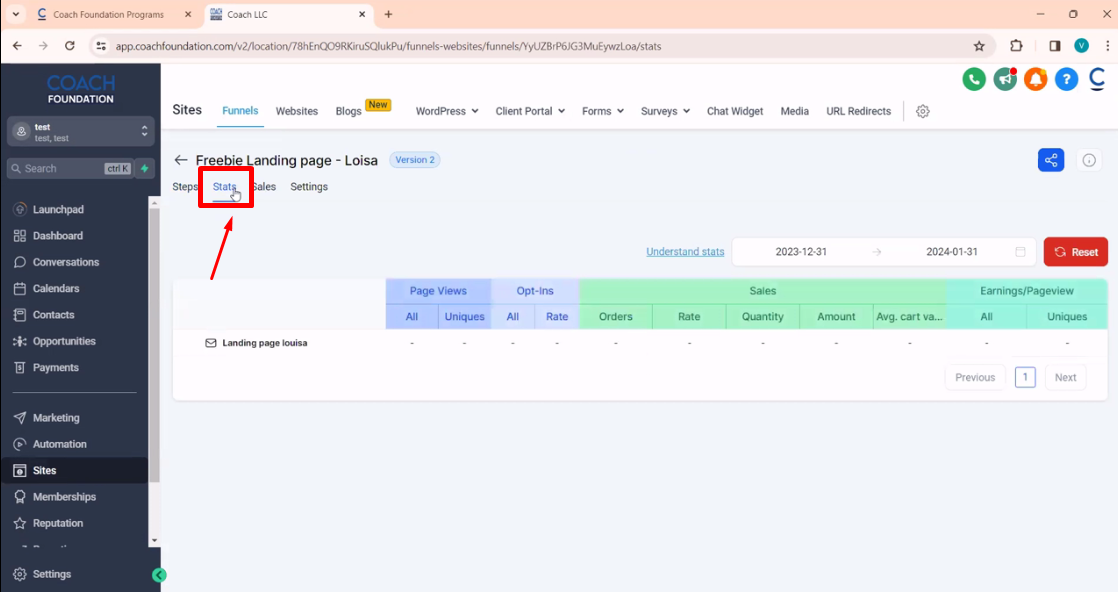
3. View Funnel Statistics:
Open a specific funnel to view its statistics.
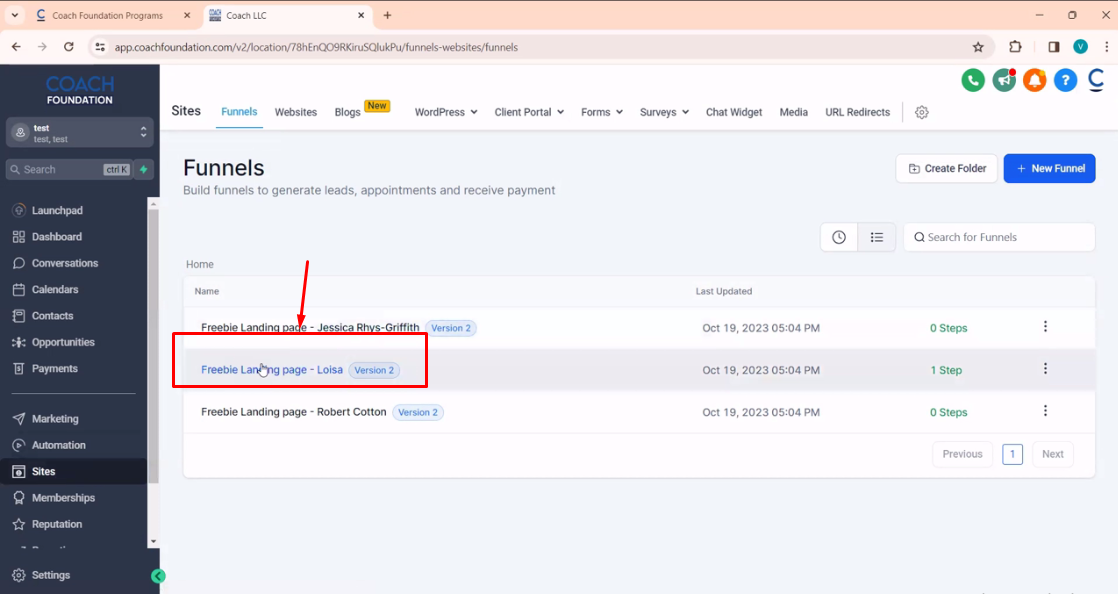
These statistics can be found in the "Stats" section, providing insights into the performance of that particular funnel. Here you can view the site's performance, analyze page views, both total and unique (indicating repeat visits), opt-ins, sales data, and total earnings.
Exploring the Reporting Section:
1. Transition to Reporting Section:
Scroll down the navigation bar and click on "Reporting" to switch to the reporting section.
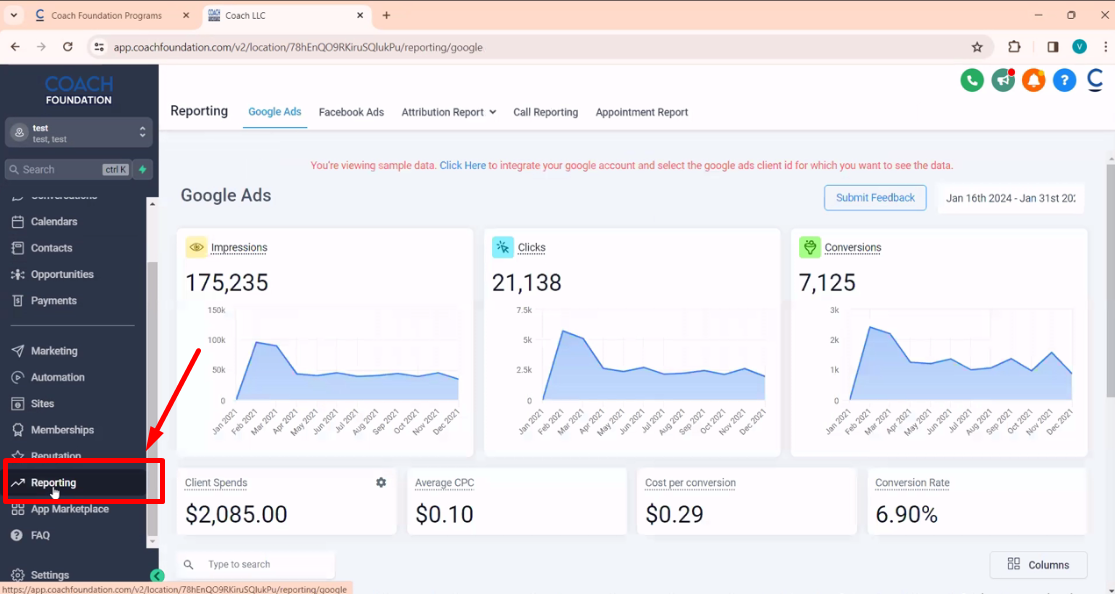
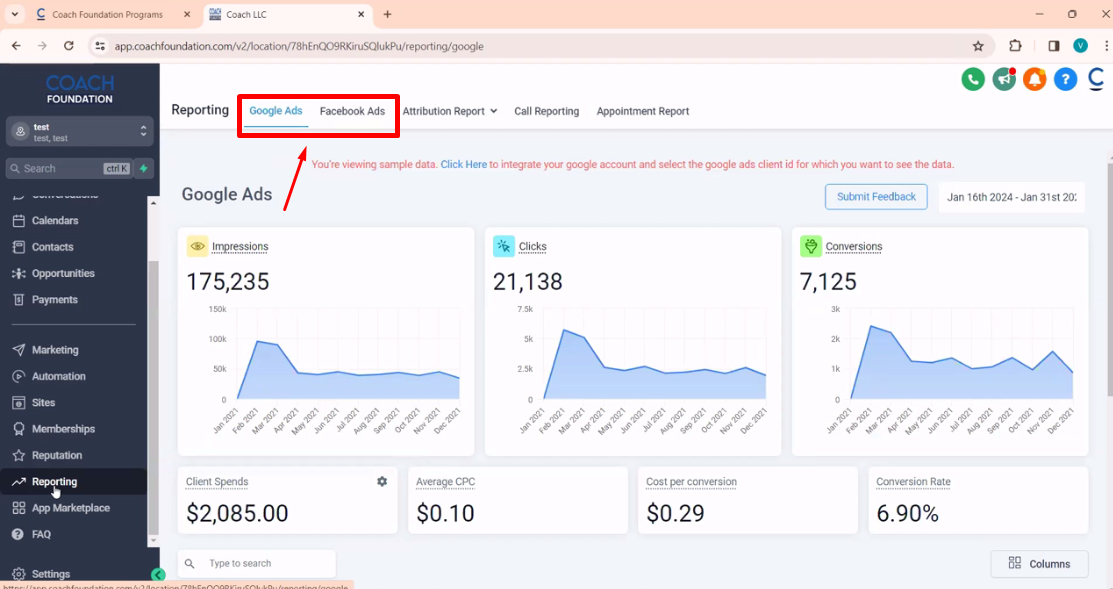
2. Sync Advertising Accounts:
In the top section of the reporting page, you can sync your Google Ads and Facebook Ads accounts. Access a consolidated view of all your advertising data, including impressions, clicks, conversions, and revenue. This step is crucial for obtaining accurate analytics.
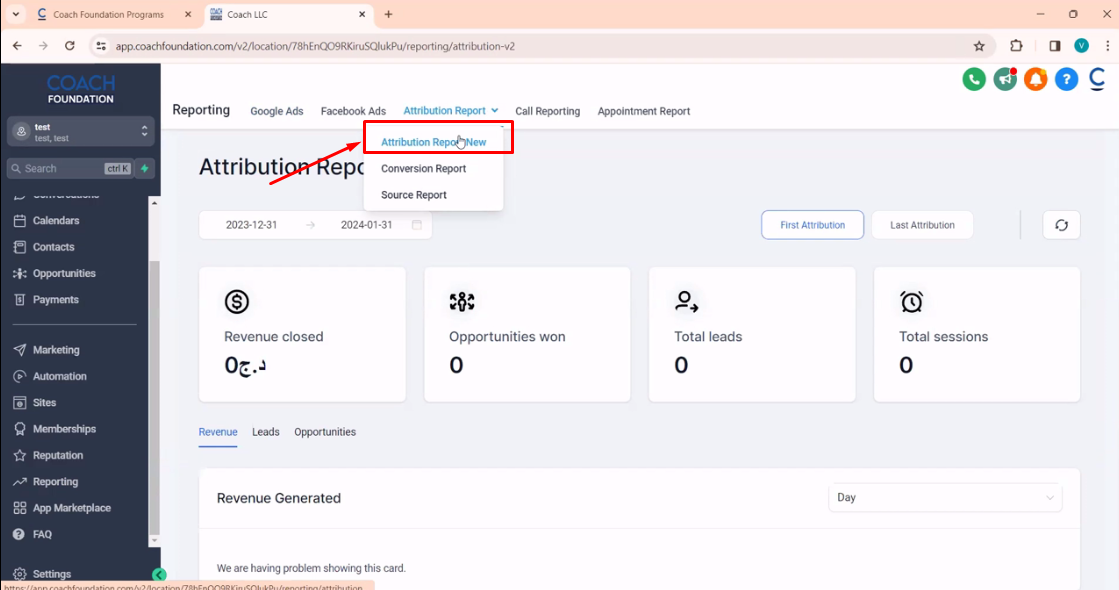
3. Attribution Report:
Hover over the "Attribution Report" to access information on attribution, conversion and source reports.
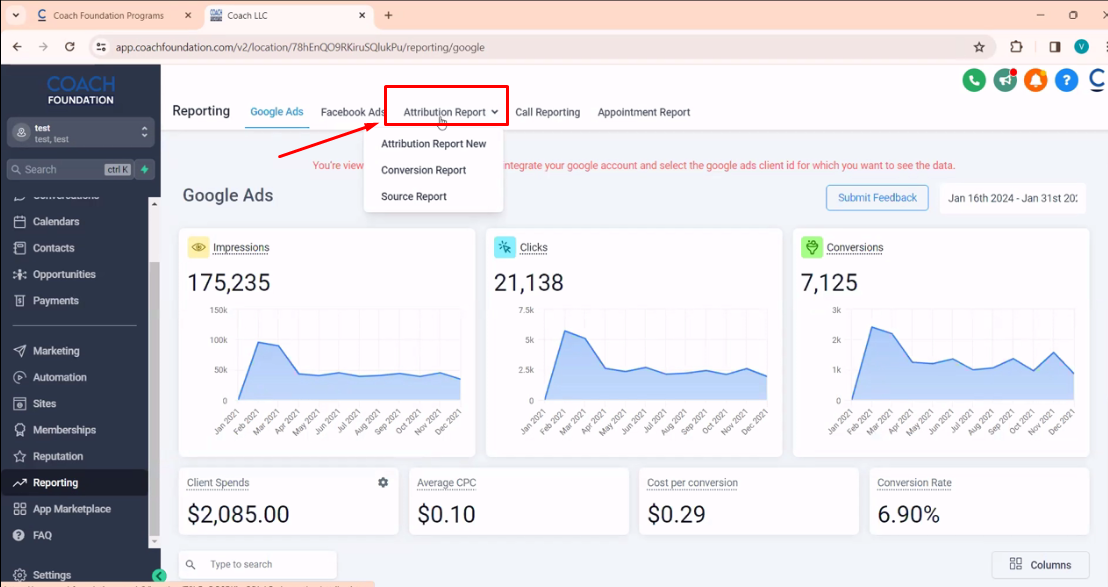
Attribution Report allows you to analyze the intricacies of customer journeys, unraveling the touchpoints that guide conversions. Understand the sequence and significance of interactions, empowering data-driven marketing decisions.
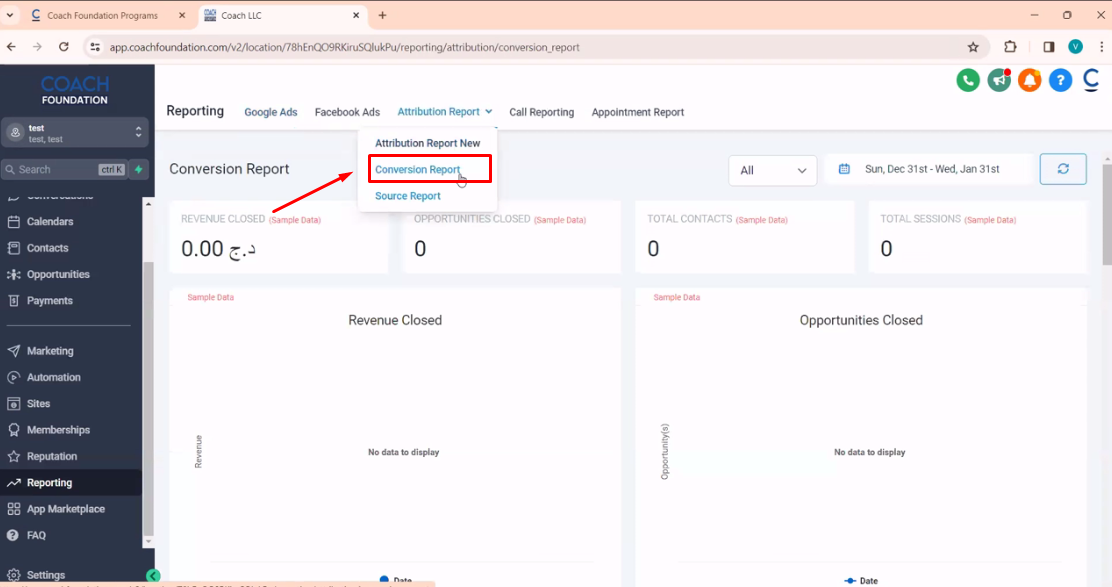
4. Conversion Report:
In the "Conversion Report", you can Track and measure key conversion events, adapting your strategies based on real-time insights.
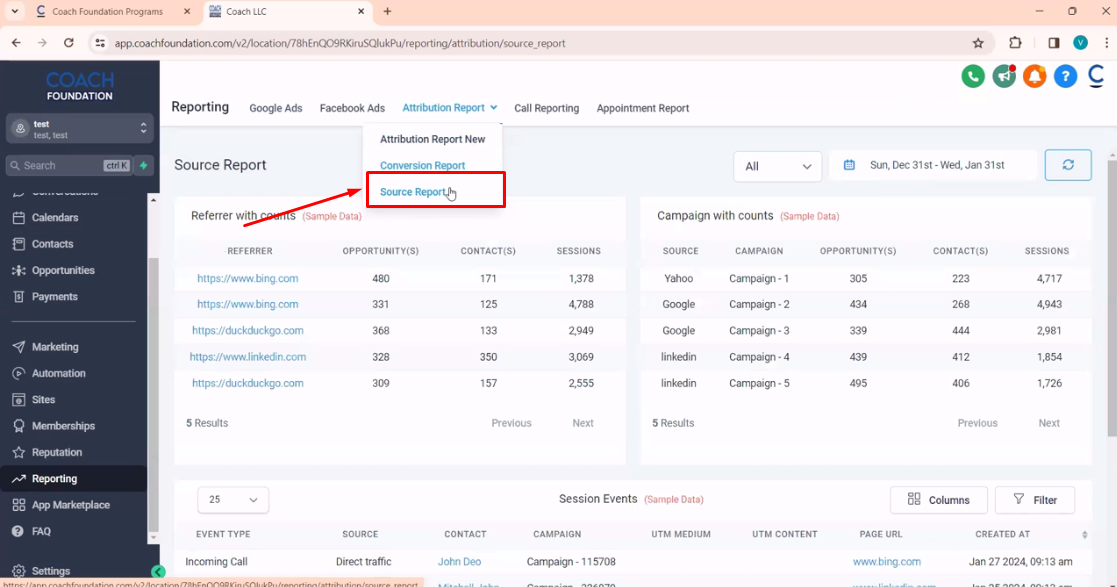
5. Source Report:
In the "Source Report" you can log client acquisition system traffic details from direct visits to referrals and beyond. By pinpointing influential sources, you can refine your marketing strategies for maximum impact.
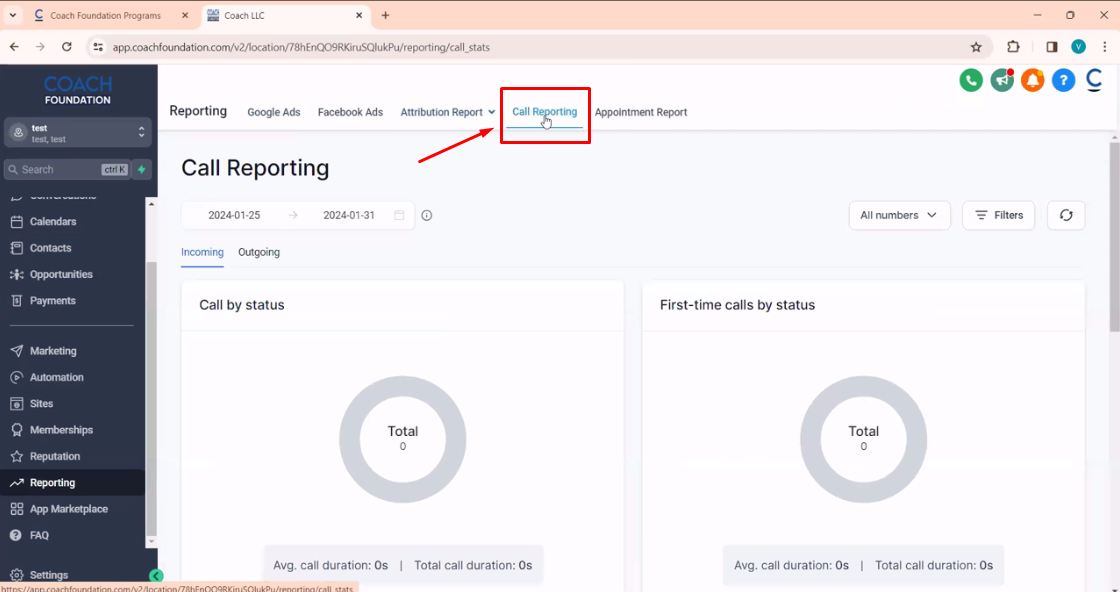
6. Call Reporting:
In "Call Reporting," you can track call-related metrics like average call duration and total call duration.
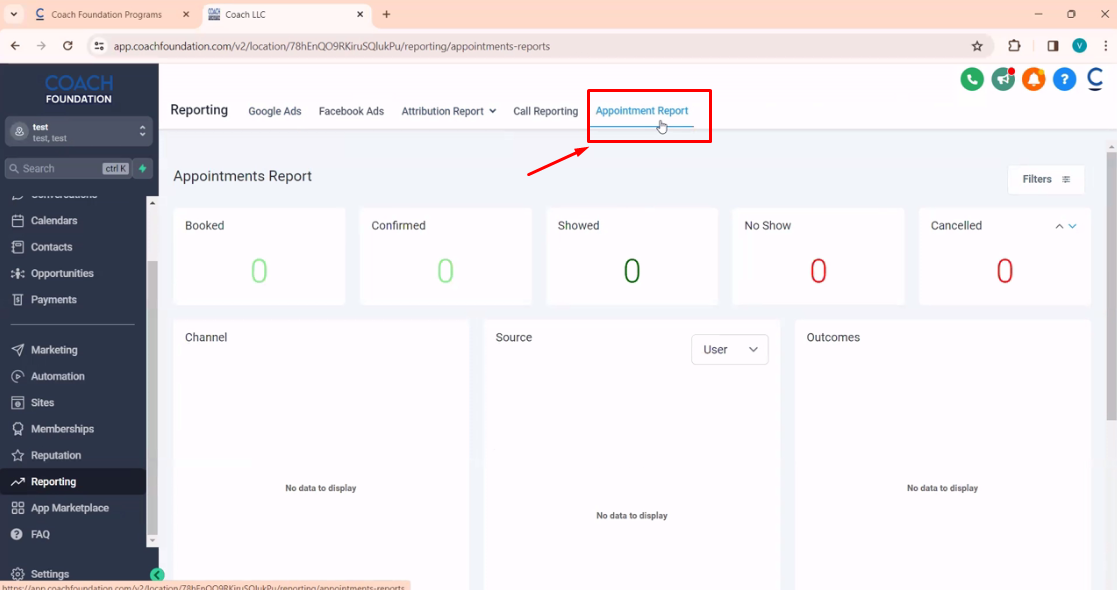
7. Appointment Report:
In the "Appointment Report," you can track the success of your appointments which are booked, confirmed or canceled. Here you can track the success of your appointments, distinguishing between successful and unsuccessful ones, allowing you to refine your appointment-setting processes.